Double tops and double bottoms are classic reversal patterns, especially prevalent in charts with shorter time frames. However, distinguishing between a genuine reversal pattern and mere market volatility can be challenging. This challenge becomes more pronounced in charts with very short time frames, like an hour or less, where market fluctuations can obscure the actual price action movement at such a detailed level.
While double tops and bottoms are powerful reversal patterns sought by traders, their interpretation can be a double-edged sword. The price often gives the appearance of forming a double top or bottom, only for the supposed resistance or support line to be swiftly breached. Fortunately, there are several strategies traders can employ to differentiate between a true reversal and a false double top or bottom.
Firstly, it’s crucial to note that a double top or bottom refers to the region where the price reverses, and this range can vary from tens to hundreds of pips depending on the time frame. When observing a potential double top or bottom and the prices for the two potential tops or bottoms are very close, the likelihood is that the pattern is false, and the price will break through those levels.
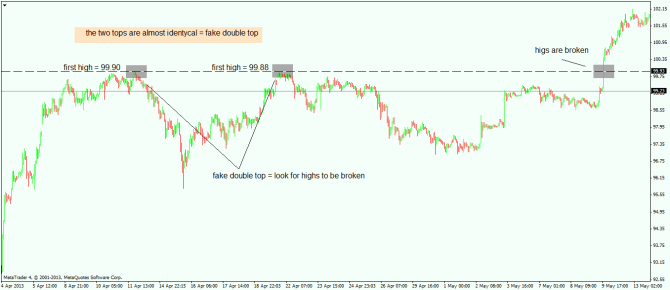
For instance, consider the USD/JPY breaking the 100 level last year. In the subsequent chart, you can observe the price approaching the 100 level, reaching 99.90 before sharply reversing. Subsequently, the price ascends nearly to the same point, at 99.88, before once again reversing sharply. When the two tops are so closely aligned, nearly identical, it signals a false double top, indicating that the highs will likely be surpassed, as demonstrated in this case.
Delaying action until the neckline is breached
In the context of a double top pattern, certain traders opt to sell when the price experiences a second dip, occurring shortly after the rebound and the formation of the second peak. While this approach carries higher risk, the potential reward is also greater.
A less risky strategy involves placing the sell order after the price has dropped below the neckline support, turning this support into resistance. When combined with the upper line, two resistances are then positioned above the current price level. Breaking through both is necessary for the upward trend to resume.
While not a foolproof method, this approach does offer some confirmation that the trend is indeed undergoing a directional change.

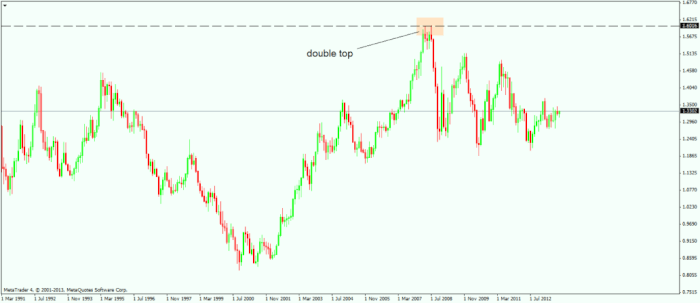
Another critical factor to consider is the time interval between the two potential tops or bottoms. The longer the duration between them, the higher the probability of it being a deceptive move. Conversely, a shorter timeframe between them, up to a certain point, increases the likelihood of a genuine reversal. An illustrative example can be found in the EUR/USD monthly chart from 2008 when the price exceeded the 1.60 level. The brief period between the two tops signifies an authentic reversal in progress, and, as observed, that is precisely what unfolded.

How to Identify a Double Top
Distinguishing between a double top and its counterpart, the double bottom, is primarily based on the number of resistance retests. The critical factor lies in recognizing the subtle differences between these two closely related chart patterns.
- Cookie Duration Description:The number of resistance retests is a defining feature. A double top involves two peaks at a similar price level, forming a distinctive ‘M’ shape. Conversely, a double bottom displays a ‘W’ shape, indicating two troughs at roughly the same level.
- Target Measurement:The target measurement is calculated from the lowest trough to the level of the intervening peak. This measurement provides an estimate of the potential downward move after the confirmation of a double top pattern.
- Market Rejection and Support:Following the formation of the second peak, the market is typically rejected from this level, retracing back to the same support level. This reinforces the significance of the resistance-turned-support dynamic.
- Third Criteria:Moving forward, the third criterion involves observing the price action as it approaches the established support level. A clear confirmation of the double top pattern occurs when the price breaks below this level, indicating a potential trend reversal.
- Trading Strategy:To effectively trade with the double top chart pattern strategy, focus on making informed decisions using naked charts. Rather than waiting for the market to swing into support with a larger stop loss, consider placing your stop loss at a shorter distance. This adjustment minimizes potential losses in case the market swiftly reverses towards the upside.
Understanding the nuances of the double top pattern and implementing a strategic approach to trading it can significantly enhance your ability to identify profitable opportunities in the market. By incorporating these insights into your trading strategy, you can navigate the complexities of price action and make more informed decisions.
Therefore, although it holds true that double tops and bottoms can serve as potent reversal patterns, the key lies in discerning with a reasonable degree of accuracy which ones are genuine and which are deceptive. Given their frequent occurrence, it’s easy to be misled, but mastering the ability to correctly identify them can unveil substantial profit opportunities.
MKTPlace is a leading digital and social media platform for traders and investors. MKTPlace offers premiere resources for trading and investing education, digital resources for personal finance, news about IoT, AI, Blockchain, Business, market analysis and education resources and guides.


