China’s stocks rise and closed higher on Tuesday, led by gains in energy and transportation companies, although Chinese-American tensions have limited further gains.
The CSI300 index, which includes the largest companies listed in Shanghai and Shenzhen, had a positive change of 0.05%, while the Shanghai index increased by 0.32%.
The energy sub-index and the transportation sub-index closed up 2.0% and 2.8%, respectively.
The United States Senate voted 86-11 on Monday to open debate on a measure that would allocate more than $ 110 billion for basic and advanced technology research over five years in the face of increasing competitive pressure from China economy.
In TOKYO, the Nikkei index advanced 2.09% to 28,406 points.
In HONG KONG, the HANG SENG index rose 1.42% to 28,593 points.
In SHANGHAI, the SSEC index gained 0.32% to 3,529 points.
The CSI300 index, which includes the largest companies listed in SHANGHAI and SHENZHEN, increased 0.05%, to 5,187 points.
In Seoul, the KOSPI index appreciated by 1.23%, to 3,173 points.
In TAIWAN, the TAIEX index increased by 5.16%, to 16,145 points.
In SINGAPORE, the STRAITS TIMES index appreciated 2.04%, to 3,142 points.
In SYDNEY, the S&P/ASX 200 index advanced 0.60%, to 7,066 points.
As the Chinese retail sector recovers from COVID-19-induced market caution, China said it will begin a series of promotional events in May, including a new consumer goods expo in southern Hainan province.
The scenario may still be changing during the week and affect the Asian economy which may have an effect on China’s stocks rise
Mark Ward, head of trading at Sanlam UK, said: “What a Bitcoin (and its rivals) is, can be thought of just as virtual money, used to buy and sell items, as you would in a shop with a five pound note – they are simply a means of exchange – it allows barter to occur online, in a virtually fraud-proof way. Whereas a central bank stands behind and stabilises traditional currencies (in the past one could exchange notes for gold should you ask the Bank of England, and UK bank notes still contain a “promise to pay the bearer” from the UK government itself), there is no bank, corporation or government acting as a backbone to Bitcoin. This is why the value of cryptocurrencies are so volatile – its value derives from the confidence in the market that tomorrow, the Bitcoin will not be worthless, and it help us to understand why Bitcoin is a commodity.
“Bitcoin is not truly a currency, at least not yet, and is best thought of perhaps as a commodity. The Dutch Tulip Mania in the 1600’s saw the price of a special type of tulip bulb rise to more than the cost of a house with an acre of land in the Netherlands, yet the intrinsic value and usefulness remained essentially nothing. But, as with cryptocurrencies, if people decide something has value, then it has value, and only time will tell if Bitcoin is another tulip-mania in the digital world, or will deliver on its promise to displace central banks and hard cash as the primary means of exchange in the future.
“One question that we often get asked at Sanlam is – “I don’t know how to mine Bitcoin, I don’t actually want to use it as currency, but I want exposure to it”. The easiest way to gain exposure to Bitcoin would be via an Exchange Traded Fund (ETF). That said we do not recommend Bitcoin as part of an investment strategy, as it has many characteristics of a bubble and something that we view as purely speculative.
“As for the future of crypto-currency, it largely comes down to three factors: whether or not Central Banks and governments release their own versions and make them the only legal tender, on indeed officially endorse a crypto-currency like Bitcoin, whether or not transaction processing speeds up from the current average of four days, and if the price volatility can be stabilised.
“Whether Bitcoin falls to near-zero like the aforementioned tulip, continues to rise like diamonds have over the past century, or simply holds steady once the market finds the level it can tolerate, is anyone’s guess at the moment, but it is certainly one to watch as it becomes better understood by the mainstream.” That opinion show us that Bitcoin is a commodity
Trading quotes to help tu understand this world. Trading requires a strong, clear mind to be able to see the opportunities and also the threats. For that, a good trader not only relies on his trading knowledge, but on his ability to foresee how a market is going to react to any given external stimulus. If he isn’t able to control his impulses, he might end up losing everything or making decisions that will drive him to that point. Skill and mental state have to go hand in hand to be successful in trading.
These trading quotes will surely help a trader to become profitable and understand that hidden mental game that underlies behind any trading endeavour:
1. “The financial markets generally are unpredictable. So that one has to have different scenarios… The idea that you can actually predict what’s going to happen contradicts my way of looking at the market.”
― George Soros, billionaire, trader and investor
2. “The markets are always on the side of exuberance or fear. It’s fear and greed. Right now greed has the better of it, which is rather nice (for investors) as long as it doesn’t get out of hand”
― George Soros, billionaire, trader and investor
3. “It’s not whether you’re right or wrong that’s important, but how much money you make when you’re right and how much you lose when you’re wrong.”
― George Soros, billionaire, trader and investor
4. “Once we realize that imperfect understanding is the human condition there is no shame in being wrong, only in failing to correct our mistakes.”
― George Soros, billionaire, trader and investor
5. “The worse a situation becomes, the less it takes to turn it around, and the bigger the upside.”
― George Soros, billionaire, trader and investor
6. “If investing is entertaining, if you’re having fun, you’re probably not making any money. Good investing is boring.”
― George Soros, billionaire, trader and investor
7. “I’m only rich because I know when I’m wrong…I basically have survived by recognizing my mistakes.”
― George Soros, billionaire, trader and investor
8. “My approach works not by making valid predictions but by allowing me to correct false ones.”
― George Soros, billionaire, trader and investor
9. “Trading doesn’t just reveal your character, it also builds it if you stay in the game long enough.”
― Yvan Byeajee, Paradigm Shift: How to cultivate equanimity in the face of market uncertainty
10. “Money is just something you need in case you do not die tomorrow. Let this is a reminder for you not to obsess over profits and losses. In whatever you do, strive for enjoyment, focus, contentment, humility, openness… Paradoxically (and as an unintended consequence) your trading performance will improve significantly.”
― Yvan Byeajee, The essence of trading psychology in one skill
11. “The expectation that you bring with you in trading is often the greatest obstacle you will encounter.”
― Yvan Byeajee, Paradigm Shift: How to cultivate equanimity in the face of market uncertainty
12. “Confidence is not “I will profit on this trade.” Confidence is “I will be fine if I don’t profit from this trade.”
― Yvan Byeajee, The essence of trading psychology in one skill
13.“The goal of a successful trader is to make the best trades. Money is secondary.”
– Alexander Elder, professional trader and teacher of traders
14. “Events, circumstances, and experiences arise and pass away. Winning trades, losing trades, fear, greed, sadness, happiness, and eventually your own life. Everything is in a constant flux. Learn to go through it with stability of mind. A meditation practice helps a lot.”
― Yvan Byeajee, Zero to Hero: How I went from being a losing trader to a consistently profitable one – a true story!
15. “Losers average losers.”
― Paul Tudor Jones, one of the greatest traders in history
16. “Where you want to be is always in control, never wishing, always trading, and always, first and foremost protecting your butt.”
― Paul Tudor Jones, one of the greatest traders in history
17. “A quiet mind is able to hear intuition over fear.”
― Yvan Byeajee, Zero to Hero: How I Went from Being a Losing Trader to a Consistently Profitable One
18. “All statistics have outliers. Money management, therefore, is key to the process of good trading.”
― Yvan Byeajee, Paradigm Shift: How to cultivate equanimity in the face of market uncertainty
19. “Trading mastery is a state of complete acceptance of probability, not a state of fight it.”
― Yvan Byeajee, Paradigm Shift: How to cultivate equanimity in the face of market uncertainty
20. “Don’t ever make the mistake of believing that market success has to come to you fast. Trade small, stay in the game, persist, and eventually, you’ll reach a satisfying level of proficiency.”
― Yvan Byeajee, Paradigm Shift: How to cultivate equanimity in the face of market uncertainty
21. “Freedom from blind reactivity begins with self-awareness.”
― Yvan Byeajee, The essence of trading psychology in one skill
22. “Money matters, but not as much as you probably think.”
― Yvan Byeajee, The essence of trading psychology in one skill
23. “Win, loss whatever emerges in the short-term, place and manage your next trades untouched, unattached… always keeping your eyes on the long-term picture.”
― Yvan Byeajee, The essence of trading psychology in one skill
24. “When you learn to let go of the need to be right, being wrong gradually lose its power to disturb you.”
― Yvan Byeajee, Paradigm Shift: How to cultivate equanimity in the face of market uncertainty
25. “Focus, patience, wise discernment, non-attachment —the skills you acquire in meditation and the skills you need to thrive in trading are one and the same.”
― Yvan Byeajee, Zero to Hero: How I went from being a losing trader to a consistently profitable one – a true story!
26. “Reaching any goal in trading requires specific domain knowledge and technical skills. But then, after that, it’s all mindset management. Yet most people ignore that —they automatically think they have that last part all figured out, and it’s a mistake.”
― Yvan Byeajee, Paradigm Shift: How to cultivate equanimity in the face of market uncertainty
27. “The process by which one accumulates money is so simple, yet so hard to implement for most.”
― Yvan Byeajee, The essence of trading psychology in one skill
28. “Genuine acceptance that there will be losses on your way to market success will greatly decrease the hurt when they eventually come.”
― yvan Byeajee, The essence of trading psychology in one skill
29. “Ultimately, consistent profitability comes down to choosing between the discomforts you feel when you follow your plan and the urge to let yourself be captures ( and ruled) by your emotions.”
― Yvan Byeajee, The essence of trading psychology in one skill
30. “There are no guarantees in trading. The sooner you accept that you sooner you can release your expectations and focus unconditionally on a proven process.”
― Yvan Byeajee, The essence of trading psychology in one skill
31 “Trading the markets is a totally self-centered activity. Nobody’s life gets better because you trade. Except your broker’s life.”
― Robert Rolih, The Million Dollar Decision: Get Out of the Rigged Game of Investing and Add a Million to Your Net Worth
32. “Always make confident that you are wise with choosing the services for your trading activities. Ensure that you will get the most reliable predictions available today.”
― Pam Sotiropoulos, a professional forex trader
Those are inspiring trading quotes for help us to trading day by day. But consider the following one.
Bonus Trading Quote
One of the most important trading quotes:
“The biggest risk is not taking a risk. In a world that’s changing really quickly, the only strategy that is guaranteed to fail is not taking risks.”
– Mark Zuckerberg, Founder of Facebook
We’ll come with more trading quotes on future articles. Keep following us.
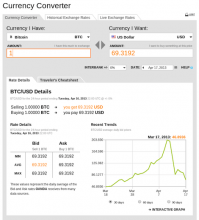
Emerging as a new online currency and a most suitable option for trading, Bitcoin is an anonymous, peer-to-peer, electronic payments system, and it is important to see it in a currency converter. Created in 2009, the Bitcoin network was originally intended to offer a means of payment through a peer-to-peer version of electronic cash. The idea was to enable online payments to be sent directly from one party to another thus bypassing financial institutions altogether. Bitcoin today is a currency trading platform in which digitally signed bitcoins are sold and purchased at a variable price of the currency. Generally 1 BTC is traded between $100 and $260.
Now highly regarded as mainstream due to recent economic woes, even major forex players are getting in on the act. Forex broker OANDA announced yesterday that it has added bitcoin into its currency converter, via a blog posting by VP of Trading, Courtney Gibson. Gibson states “We recently added Bitcoin to the OANDA Currency Converter. We admire it as an interesting experiment in financial innovation and, because we’re financial innovators too, we share the excitement such disruptive technologies can bring to mature industries and markets.”
Oanda states that Bitcoin appealed to their sense of great customer service. ‘Now, anyone who wants to calculate the conversion of currencies (or gold and silver) into Bitcoin can use OANDA’s popular converter as their tool of choice’ So thats the good news. The blog posting was quick to point out that “Despite the increased awareness around the cyber currency, OANDA has no plans at this time to introduce Bitcoin as a tradeable currency to OANDA’s fxTrade platform, or to accept Bitcoin as a method for funding fxTrade accounts. By adding Bitcoin to our Currency Converter, we are acknowledging – in a very real way – the wide-ranging interest Bitcoin has generated as a virtual payment system.”
Thus far, with the exception of of IG’s bitcoin binary product launched last week, major forex brokers have yet to offer major bitcoin offerings due perhaps to uncertainty or monitoring for stability which will only come when trade volume (on the USD/other fiat side) increases, and network infrastructure improvements can be addressed.
QuantConnect – where cloud computing meets open data for Algorithm Trading.
QuantConnect, a radical FinTech open data trading startup was established In 2011 with an ambitious goal: offer open trading data algorithm technology to mainstream audiences. QuantConnect follows the concept of open data philosophies that data should be freely available to use and republish as necessary, without restrictions from copyright, patents or other mechanisms of control. The founders aim to empower the general public with powerful tools to make trading and investment accessible through advanced technology to general audiences.
Jared Broad, QuantConnect co-founder and CEO won a Start Up Chile grant In 2011 and since that was invited to the TEDx Wall Street event and Battle of the Quants in New York (April 2012). In this last conference founded focusing exclusively on the growing quantitative hedge fund community and industry, by the hedge fund visionary Bartt C. Kellerman’s Global Capital Acquisition in 2006, Jared has been displaying his vision of a further advanced trading platform that can push the boundaries of algorithm trading, using the most advanced technologies to offer open data.
QuantConnect, offering: Equity, FX tick, Earning predictions, and Twitter Sentiment Analysis
Offering US equities tick data going back to January 1998, and updated daily with latest market data QuantConnect displays over 16,000 stocks, in an open library of data provided by QuantQuote. Besides this it offers an impressive FX tick data on 13 major currency pairs going back to April 2007, and updated daily with most recent market provided by FXCM.
With another deal with Estimize QuantConnect provides quarterly earnings predictions generated by a community of 13,000 traders and investors. Through the data from Estimize that goes back early 2011 and covers most stocks QuantConnect manages an impressive better than most of Wall Street’s predictions, such as 69% of the time better performance!
Last but not least through a partnership with StockPulse QuantConnect provides Twitter Sentiment Analysis to identify the most relevant capital market moods, rumors, and market-moving trends with it offering a valuable array of trading ideas and signals on every traded asset in the world.
QuantConnect startup seeded in Chile and New York
QuantConnect is a new trading and investment cloud-based algorithm service and community startup that was seeded between Chile and New York. The company aims to level the playing field for independent traders by providing the right technology tools to design and execute present and future proof trading strategies, and back-test their programs using historical market data.
The project is the brainchild of Jared Broad, serial entrepreneur born in New Zealand, founder of automated trading firm Stocktrack.org, and Shai Rosen, founder of Chilean auction website Ganeselo.com.
The service has been in the beta-testing stage for the past year with programmers including graduate students interested in pursuing a career in quant trading, and computer scientists from leading financial firms. The firm has been working quite hard in its disruptive strategy and has signed up thousand of prospective clients in its community platform and raise its profile at conferences such as Finovate in London and TechCrunch in San Francisco. During the process the firm has been creating an unique space in the algorithm trading industry, including the respect and support of employees of Google and Facebook. Tshe recent partnership with high profile trading global players such as FXCM and tech innovators such as Estimize and StockPulse gives them an unique outstanding spot.
The Plan
Looking further ahead, the firm has plans to set up a hedge fund based around the most successful managers, marketing individual strategies to retail investors via online brokerages, and packaging the best algorithms as an exchange-traded fund.
Although QuantConnect appears to have first-mover advantage in what could be a very lucrative market, they have at least one potential competitor in the form of Quantopian, which is working on a similar offering. The Boston-based technology shop has the backing of VC investor Spark Capital and high-frequency market maker Getco.
The Technical Nitty-Gritty
Unlike MT4, which uses the proprietary MQL4 programming language for its algorithms, Quantconnect uses the C# programming language, a general-purpose object-oriented language derived from the popular C/C+/C++ family of languages. Programmers can design and back-test their strategies for free, using vast cloud computing power leased from Amazon.com, and will only be charged when they want to make trades with their strategies by setting up trading accounts.
Instant access to this massive computing power means that a simulation based on 30 stocks in the Dow Jones Industrial Average could be run in a matter of minutes. By comparison, the same calculations on the average desktop computer would take several days to compute.
Applying principles of openness and transparency in all aspects QuantConnect is creating a spot in a high competitive and disruptive part of the global financial and trading world. For that QuantConnect defines themselves as an innovative company giving any advanced algorithm trader or a complete access to an enormous library of financial and capital markets data, thanks to a generous network of data partners for providing the right resources.
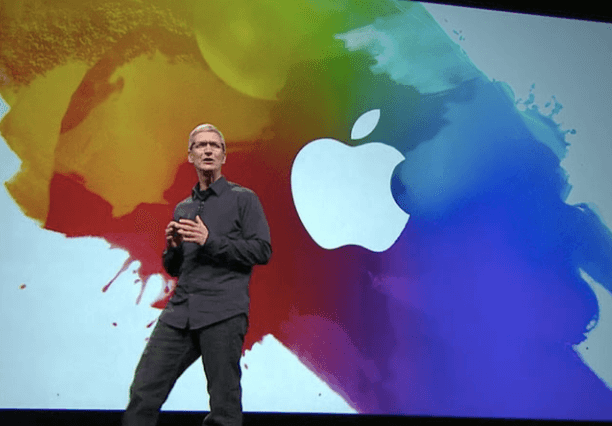
Apple Invests USD 1 Billion in China-Based Ridesharing Company.
In a day where the legendary Warren Buffet invested in Apple there are two things we know now about Apple: First, the company is serious about cars. Second, it’s ready to start looking beyond the iPhone.
Apple and cars
While it has remained mum on just about every rumor about its ambitions to build a proprietary car, Apple made an unprecedented decision to invest $1 billion in the “Uber of China,” Didi Chuxing.
So why would Apple put a billion dollars into a non-tech, non-consumer electronics company? Autonomous vehicles.
China has moved surprisingly rapidly to get autonomous cars on the streets. The country’s government recently released a draft proposal that would allow driverless cars on the country’s highways in 2020 and on city streets by 2025. Since Apple wants to create its own driverless cars, where better to invest than the largest car market on earth, which also happens to be the most progressive market in terms of getting driverless cars on the streets?
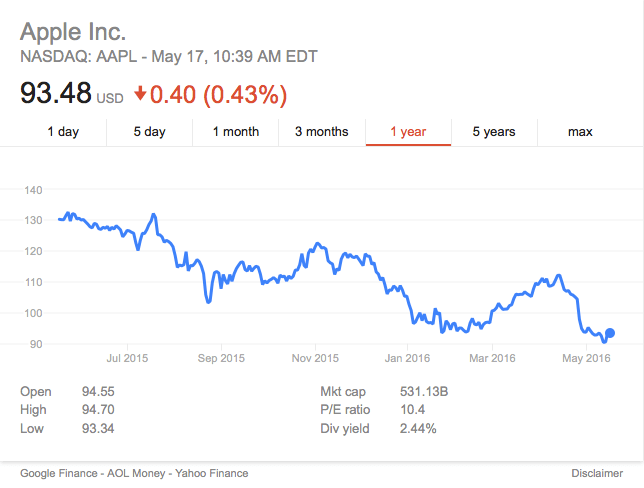
Apple’s product slowdown
We’ve said it before. Apple invests and has finally reached a plateau in terms of innovation. Despite releasing several new products and services over the last few years — i.e. Apple Music, Beats Music, Apple Watch, Apple TV etc. — there hasn’t been anything compelling enough to turn into one of the company’s next big things. The trifecta of the iPhone, the iPad and the Mac is no longer what it once was. And the iPhone made up 65% of the company’s revenue during the latest quarter.
Considering Apple has never really invested in startups — if it sees something it likes, it just buys it to add it to its own fold — it sounds like Tim Cook is finally ready to admit that the Apple as we knew it is gone. Now it’s time for Apple to start using its cash to invest and hopefully insulate the company enough in case of an iPhone slowdown too.
Wooing China
Another potential reason for the investment is for Apple to get back on China’s good side. After all, why not just invest in Uber, which recently entered the Chinese market?
Apple has had some challenges in China recently. With smartphone sales for the company shrinking in the country, it lost an iPhone trademark dispute and has had some of its online entertainment services suspended following pressure from the Chinese government.
Of course, Apple’s not the only U.S.-based company struggling to cozy up to Chinese government officials. Dropbox, Google, Twitter and Facebook have all been banned from the country, likely due to the fact that they compete with Chinese tech companies.
Thus, one of Cook’s strategies could show that Apple is willing to get its own skin in the game in favor of China-based companies to show its dedication to the country’s own economic success. Whether that move makes a difference or not, of course, remains to be seen. As we’ve all seen before, the Chinese government is quite arbitrary in its decisions when it comes to U.S.-based tech companies.
One thing is for certain, however: Apple has entered a new frontier.
APPLE Stock last year May 2015 to May 2016, source Yahoo Finance
Zug-based investors CV VC, in collaboration with consultancy PwC Strategy& Switzerland and technology provider inacta, has compiled the first ever list of the top 50 companies in Crypto Valley. It reveals that Blockchain companies employ around 3000 people in Switzerland and Liechtenstein and have a combined market capitalization of US$ 44 billion. Included among the top 50 are five unicorns – startups with a market valuation of over a billion dollars.
The number of companies in Crypto Valley working with blockchain technology is growing rapidly. As of September 30, 2018, a total of over 600 blockchain related companies in Switzerland and Liechtenstein were registered on CV Maps, an online directory of the blockchain industry created and maintained by CV VC. The number is nearly double that recorded in the spring of this year.
CV VC, a blockchain-focused investor and incubator in Zug, has worked with PwC Strategy& Switzerland and the information management firm inacta to identify the top 50 Crypto Valley companies based on CV Maps data.
Strong capital base
Companies qualifying for this crypto super-league must meet three criteria: Firstly, blockchain technology has to be part of the company’s core business, secondly, it must employ more than one person in Switzerland or Liechtenstein, and lastly, it should make some contribution to the blockchain ecosystem and the wider Crypto Valley community. There are three additional criteria, at least one of which must be fulfilled: Funding in excess of US$10 million, a valuation of more than U$10 million or the provision of at least 10 full-time positions in Switzerland or Liechtenstein.
CV VC’s report sheds light on the various sub-sectors of the industry, their market capitalization and their headcount.
There are three additional criteria, at least one of which must be fulfilled: Funding in excess of US$10 million, a valuation of more than U$10 million or the provision of at least 10 full-time positions in Switzerland or Liechtenstein
Some highlights at a glance:
At the end of September 2018, CV Maps directory contained over 600 companies working with blockchain technology (directly, or as a service provider, such as specialized consultancies, law firms, blockchain organizations and academic institutions).
According to CV Maps database, Blockchain companies employ around 3000 people in Switzerland. The Top 50 alone counts 443 employees. Most companies employ many more people abroad.
The Top 50 companies together have a market capitalization of around US$ 44 billion, however the consolidated value of the sector overall can only be estimated, as many companies do not publish exact data.
The Top 50 companies have a very strong capital base, especially compared to other startups. Many of them have funding in the tens or hundreds of millions.
Five Blockchain Unicorns are either based in or have originated from the Crypto Valley: Bitmain, Cardano, Dfinity, Ethereum and Xapo.
Crypto Valley contains a large subset of the blockchain industry, from health tech to data analytics to e-government. Two secondary areas feature in the top 50 list: the first is broker, trade & exchange and the second is platform & protocol. Each is represented by 11 companies. Other sub-sectors that include many companies are hardware & middleware as well as community, P2P & loyalty.
In addition to CV Maps’ own databases, data used to compile the Top 50 was drawn from information provided by the companies themselves, from crypto exchanges, media reports and social media such as LinkedIn. Where no information was available, estimates were made and declared as such in the CV VC Report. Estimates of worth were rounded into four categories: $10 million, $25 million, $100 million and $1000 million ($1 billion).
“The Top 50 report shows that Crypto Valley has retained its appeal as a location for blockchain companies from all sectors” said Ralf Glabischnig, founder and managing partner of information management firm inacta, which built the CV Maps database.
The new information provided by CV Maps sheds light on the rapid growth rate of Crypto Valley. At the time of its April 2017 launch, the online directory contained 350 companies, just over half as many as there are today.
The new information provided by CV Maps sheds light on the rapid growth rate of Crypto Valley. At the time of its April 2017 launch, the online directory contained 350 companies, just over half as many as there are today
Partnership with PwC
CV VC’s collaboration with PwC in developing the Top 50 report is part of a long-standing strategic partnership between the consulting firm and CV Labs, the CV VC’s co-working space in the center of Zug.
Daniel Diemers, PwC Strategy& EMEA Blockchain Leader, said: “Crypto Valley has grown enormously in just three short years. Even two or three years ago, there were just 10 to 15 companies in the blockchain industry. PwC was quick to realize the potential of Blockchain and how it is important for companies to understand the technology and to get close to innovative startups in the field“.
“Partnering with CV Labs and CV VC gives our clients this access. From the other direction, we also want to bring startups closer to potential investors and partners“, said Daniel Diemers. PwC has a global team of 2,000 blockchain specialists.
CV Labs, CV VC’s coworking space in the heart of Zug, is home to a growing number of blockchain startups, crypto funds, academic institutions and industry group The Crypto Valley Association since the beginning of 2018. With more than 100 tenants, Crypto Valley Labs has grown fast, opening two new floors of office space in September. “The strategic partnership with PwC shows that established companies are now entering the blockchain industry,” said Mathias Ruch, CEO of CV VC.
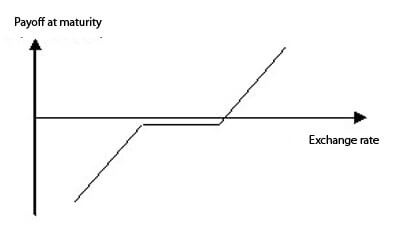
Risk reversals reflect the expectation of the market in terms of the direction of an exchange rate. When used in the correct context, risk reversals can be highly useful for generating potentially profitable overbought and oversold signals.
A risk reversal is a combination of a call and a put option on the same currencym withe the same expiry (one month) and the same sensitivity to the underlying exchange rate. They are quoted in terms of the difference in volatility between the call and the put options. Theoretically, these two options should have the same implied volatility, but in practice they often differ, and this difference can be a useful indicator.
Guide to Forex Options Trading Part 9: Risk Reversals
If the number is positive, it shows that the market expects the underlying currency to move upwards in price, and that calls are therefore preferred to puts by the market. Similarly, a negative number shows that puts are preferred to calls, and that the market expects the underlying currency to move downwards in price.
Risk reversals are useful in terms of their ability to poll the market, with a positive risk-reversal number implying that the majority of market participants are voting for a rise in the currency rather than a drop. Therefore, they can be used as a tool for evaluating positions on the forex market.
Although the signals that a risk-reversal system generates are not always completely accurate, they can tell you whether the market is bullish or bearish overall. They convey the most information when they have relatively extreme values. An extreme value could be defined as being one standard deviation beyond the averages of positive and negative values. For negative risk-reversal numbers, you are looking for values of one standard deviation below the average, and for positive numbers you are looking for values one standard deviation above the average.
Risk reversals give contrarian signals when they are at these extreme values. This is because when the entire market is positioned for a rise in a certain currency, it makes it harder for that currency to rise, and much more prone to falling as a result of negative news or market events.
A big positive risk-reversal number implies a situation where the currency is overbought, and conversely a big negative risk-reversal number indicates that it is being oversold. While the buy or sell signals that risk reversals are not perfect, they can at least give you some extra information with which to inform your trades.
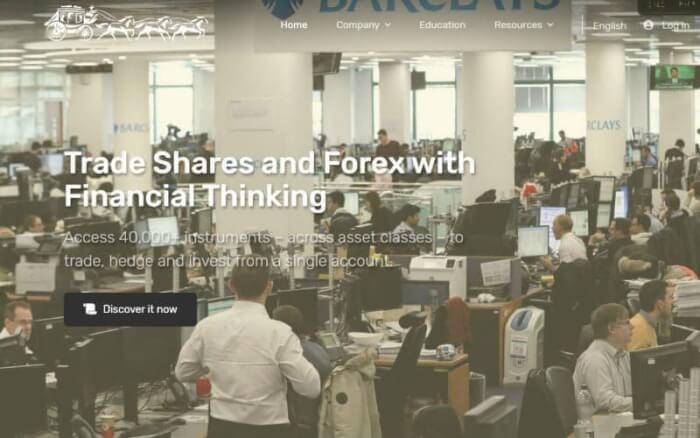
If you are new to the world of trading, there is a lot you need to learn before you can start making winning trades. While most of this learning involves trading strategies and tricks, you also need to learn a bit about the trading environment. One of the first things in the trading environment you should get familiar with is the trading room. Knowing what a trading room actually is and what happens in these rooms is important if you want to have control over your trading attempts. So, here is a detailed explanation of what trading rooms entail.
Trading Rooms
In the context of financial markets, a trade room is an office space where buying and selling of financial products is carried out. People working in this trading room, making these sales and purchases, are known as traders. These trading rooms can be found in the buildings of most trading organisations and stock exchanges. In addition to that, you can also find trading rooms in other companies like brokerages and investment banks. Due to the hectic and chaotic nature of trading rooms, they are also often referred to as “the pit” in a company involved in trading activities. The other terms that are often used to describe trading rooms are “front office”, “trading floor” and “dealing room”. These trade rooms are often the first to be equipped with the latest technologies an organisation decides to invest in.
Origin
The trading rooms became popular in the late sixties and early seventies. Before that, capital markets had several split departments located at different sites based on market segments like bond markets, exchange, foreign exchange and money markets. The concept of the trading room was based on the need of a single space where all these different financial products could be traded at the same time. The aim behind bringing these departments to a single site was to make broadcasting of market information more efficient so that traders can react to the latest changes and trends more quickly. The traders also wanted to improve desk coordination to provide a better trading experience to the customers.
Popularity
The trading rooms were first established in the US in 1971 when the NASDAQ index was created. It was between 1982 and 1987 that trading rooms gained popularity across Europe. Two financial market organisation reforms introduced simultaneously in France and the United Kingdom fostered the growth of trading rooms in the continent. Several new trading opportunities arose, and as a result the need for more traders working together emerged, giving rise to the idea of trading rooms.
The Businesses Having Trading Rooms
Two types of businesses that make use of trading rooms are:
Institutional investors, asset management companies and portfolio management companies that are involved with the buying side of the business.
Investment banks, brokers, and other arbitrage and trading businesses that are involved with the selling side of the trade.
Depending on the type of business that is operating a trading room, the technologies, systems and software used in these rooms vary. It was the sell side that was first to establish trading rooms, followed subsequently by buying companies.
How Do These Trading Rooms Work Today?
Today, the structure of trading rooms has changed significantly from what it was a few years back. The introduction of online trading platforms has given rise to the concept of virtual trading rooms where traders don’t gather in a single real space but instead, use a single online platform which is referred to as a trading room. In trade rooms today, trades can be carried out in a number of ways, either electronically or personally. Telephone calls, online platforms and verbal face-to-face communication, all are a part of trading rooms nowadays.
The trading room is covered with a number of television screens that allow the traders to keep up with the latest news and happenings at all times. If you ever visit a live trading room during trading hours, it is one of the liveliest and chaotic places you would come across. With hundreds and thousands of traders involved in continuous trading activities, it is hard to catch a free minute while you are in a trading room. For a trader, this is the room where they can make or break their fortune.
Forex social networks represent a rapidly growing phenomenon in the realm of FX trading. These platforms empower their members to observe the trading activities of other individuals, both on an individual basis and collectively. The primary aim is to enhance their understanding of the market and glean insights into the trading strategies employed by others. In certain instances, these networks even facilitate the replication of trades executed by successful traders, albeit in exchange for a commission.
In virtually any other market, engaging in collaborative trading of this nature would be strongly discouraged. However, the unique dynamics of the retail FX market, which is significantly smaller when juxtaposed with the expansive inter-bank market, mean that the actions of retail traders exert minimal to no impact on the prices of currency pairs.
Remarkably, on the majority of leading forex social networks, approximately 50% of participants realize profits by mirroring the trades of others. This stands in favorable contrast to the broader statistic for the entire retail FX market, which hovers closer to 30%. Presented below are seven of the foremost social media forex platforms currently accessible on the internet.
TradingView stands out as the most recent addition among the Forex social networks highlighted in this discussion. Despite its relative youth, the platform has swiftly become a cornerstone for sharing financial charts within the trading and investment community. Traders on TradingView have the opportunity to convey their insights through intricate charts equipped with a variety of graphical tools, complemented by detailed text descriptions. The interactive nature of the platform allows other traders to subscribe to those who share their analyses and cast votes for the most noteworthy charts.
TradingView has earned acclaim for its chart gems, compelling many to visit the site periodically, even if they are not members or do not intend to become one. Regrettably, as of now, the platform does not provide automated trade-copying functionality. For those interested in chart pattern trading, my TradingView profile is also available for following.
With over 1.75m traders in its network, and more than 200,000 live accounts, eToro can claim to be one of the most popular Forex trading networks on the web, although it caters for commodities traders as well. Users receive $10 every time somebody copies one of their trades, and their trade copy platform has one of the highest success rates around.
This is another very popular FX social network, with a huge community of traders. It does not require users to register in order to track the trades of others, and it does not differentiate between real and demo accounts. While it may not be as slick as some of the other websites on this list, the sheer amount of activity on the site more than makes up for this.
For many years, Forex Factory has been the biggest and most active FX forum on the web. Recently, the site has been overhauled to include many of the features of a Forex social network, such as market sentiment socialisation and trading performance tracking with an in depth analysis. Given the size of the community that already exists on this forum, it shouldn’t be too much of a stretch for them to grab a sizeable chunk of the Forex social networking market over the next few years.
MeetPips, a derivative of the well-known Forex educational platform BabyPips.com, maintains a design coherence with its parent website. Notably, MeetPips distinguishes itself as the most visually attractive site within this compilation. It introduces distinctive features, including the capability to view a consolidated trading journal, trading plan, and trading statistics for each member.
Despite these positive attributes, it’s important to note that the analysis of trading statistics on MeetPips is relatively modest. Furthermore, the platform’s smaller member base and comparatively lower level of activity may diminish its appeal when juxtaposed with some of the more dynamic networks featured in this list.
This website closely resembles MyFXBook but boasts a more polished design and a much more user-friendly interface. However, the primary allure of a social network lies in the size of the community and the level of social activity, and in these aspects, it falls somewhat short compared to MyFXBook. Nevertheless, as a tool for strategy analysis, it can prove to be quite useful.
Education is the key to becoming a successful forex trader. Babypips is a useful tool in this field. While there are many fine further education courses out there for those who are looking to learn the basics of trading and hone their skills, they can be quite expensive. However, if you are self-disciplined enough to study independently, without the need for external pressures to guide your development, then there are many online educational resources that are available free of charge.
One of the leading lights is Babypips, a popular forex education website that combines a range of useful resources for traders of all experience levels, including an online course, analyst blogs, a busy forum, a forex encyclopedia, and tools including an economic calendar, a brokers guide, a currency converter, and various specialised forex calculators.
The Babypips team of experts, known as the ‘FX-Men’
Perhaps the most immediately obvious difference between Babypips and competitors such as Forex Factory and Forex Crunch is the friendly, cartoony tone adopted throughout. The site makes use of cute, comic book-esque graphics throughout, with their analysts being referred to collectively as the ‘FX Men’, with pseudonyms such as Robopip, Forexninja, and Cleopiptra, and are depicted as cartoon characters.
It’s all an effort to make forex trading, traditionally a rather dry world of charts and number-crunching analysts, that little bit more accessible and fun for the beginner. While the constant stream of pip-related puns and jokey asides may not be to everyone’s taste, they certainly mark a departure from the norm for this type of website.
Joking Aside
Despite the air of levity that pervades all the content on the site, the information is as solid and as in-depth as you will find anywhere. In particular, their ‘School of Pipsology’ covers a very comprehensive range of topics from the basics of the forex market and placing trades to sophisticated analysis techniques. It does quite a good job of demystifying some of the more complex topics, and the friendly tone can help to assuage some of the boredom that can set in when discussing technical topics of any nature. It takes the trader on a journey from novice to expert via short, modular lessons that can be ticked off as they are completed so that you can keep track of your progress.
The Babypips.com home page
The blogs section is the main focus of the site aside from the school, and is updated on a daily basis by a team of top analysts from the world of currency trading. Each specialises on a different topic, with Robopip for example covering algorithmic trading techniques, and Pip Surfer covering trading systems. They also post their most recent trades on the website in a similar fashion to social trading websites.
The forum on the website might not be as heavily populated as the ubiquitous Forex Factory forum, but it is nonetheless a useful and well-moderated resource with a lot of knowledgeable contributors. The most popular sections, at the time of writing, are Newbie Island, which as the name suggests covers the questions of beginner traders, and Free Forex Trading Systems, where users can view and share systems for trading the forex market.
Tools for Traders
Babypips also hosts a range of useful tools for forex traders, including:
Forex Economic Calendar – a guide to when to expect all the major market-moving news releases, market holidays, and other currency-related events.
Forex Broker’s Guide – everything you need to help you choose a forex broker, including what to look for, a comprehensive list of brokers with all the essential stats, a broker comparison tool that enables you to view detailed information about up to three brokers side-by-side, links to the relevant national regulatory organizations, and a glossary of commonly-used terminology.
Currency Converter – A simple converter for finding out how much one unit of currency will buy you of another at the current bank rates.
Forex Calculators – A range of useful calculators to help you assess and evaluate trades and set up charts, including a Fibonacci Calculator, a Pip Value calculator, a Pivot Point calculator, a Position Size calculator, and a Risk/Reward calculator.
The other main resource on the site is the Forexpedia, a free encyclopedia covering all the forex terminology you are likely to come across, in an easy letter-search format. So if you ever come across a word or phrase, and you’re not sure what it means exactly, then you can look it up here and all will be revealed.
All in all, Babypips is a friendly and welcoming addition to the world of forex trading online, providing an easy route into learning about trading for beginners, but with enough depth of information to keep experienced traders coming back for new ideas and to brush up on their knowledge and skills. In addition to the constantly-updated information on the site, they are also very active on Twitter and Facebook, with regular market updates and links to useful resources.
When it comes to trading platforms, independent traders are literally spoiled for choice with a huge range to choose between. Most brokers offer a range of platform options, often including the ubiquitous MetaTrader 4 or other advanced desktop platforms such as NinjaTrader, social trading platforms such as eToro’s OpenBook and FXCM’s Tradeo, and their own proprietary platforms. These proprietary platforms are either designed in-house or licensed from white-label providers such as Sirix, Currenex, or Saxo Bank, and it is this type of platform we shall be taking a look at today. If we’ve left any out, let us know in the comments box below and we’ll do our best to include them!
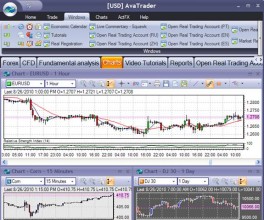
Avatrade’s own platform is available in three forms – desktop (for downloading to Windows PCs), web (for Mac, PC, and Java-enabled tablets) and mobile (for smartphones and tablets). It’s an easy-to-learn yet powerful platform that enables you to trade directly from charts, using any of over 30 built-in indicators to inform your trades, and also to test and implement auto-trading routines.
This basic, online-only platform is compatible with Mac and PC, and provides a range of useful features for the online trader. It’s user-friendly and intuitive interface allows for drag & drop customisation, one-click trading, and a range of real-time technical analysis tools. For those that require more advanced features, the platform can be easily integrated with Metatrader 4, and the platform is also available as an app for iPad, Android, and iPhone.
Sirix WebTrader
This is a non-proprietary web-based trading platform that is used by a variety of brokers, including Go Forex and Caesar Trade. Because it’s browser-based, you can access it with virtually any web-connected computer or device, and because it is designed to integrate with MT4, it can be the perfect solution for MT4 users who need to access their accounts when they are not at their own desktop computer. As well as full MT4 integration, it offers a number of advanced features of its own, such as built-in risk management and social trading.
Investment banking giant Citigroup’s CitiFX Pro trading platform comes in desktop, web, and mobile versions, and combines ease of use with advanced functionality. While the interface is indeed slick and intuitive, it is the ability to tap into Citi’s award-winning research that makes this platform stand out. In addition, the platform offers a full range of stop order functionality, advanced charting, and one-click execution of trades.
Like many of the more recent entrants to the online trading arena, One Financial Markets has opted to make their own platform a browser or mobile-based effort that integrates fully with MetaTrader 4. These are nothing out of the ordinary, but they are reliable, intuitive, and work well as an adjunct to the more powerful MT4 for desktop computers.
Definitely this should always be among the most popular trading platforms. This browser-based platform is one of the slickest around, combining ease of use with relatively advanced functionality for a non-software solution. Just about everything you might need to do, from setting trade orders to using technical analysis tools can be achieved just by clicking on the graph. It’s a speedy interface, and there are keyboard shortcuts for every single function to save the trader valuable time.
Currenex is a non-proprietary forex trading platform that is offered alongside MT4 by some brokers, including Hantec Markets and Alpari. There are two versions, Currenex classic, which is aimed at institutional investors, and Currenex Viking, which is designed for the independent investor. Both versions are very powerful indeed, with full implementation of scripts and algorithmic trading, detailed accounting and charting features, and fully integrated Straight-Through Processing (STP). While the browser-based version of the platform is the most widely used, there is also a downloadable desktop version and apps for mobile devices running on Android and iOS.
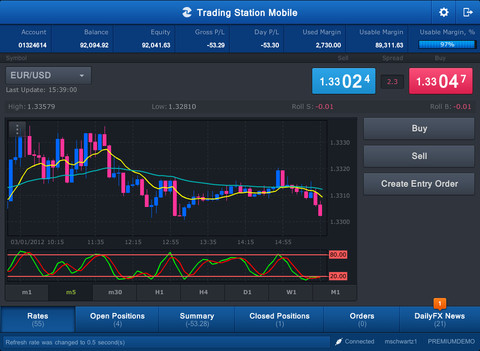
Trading Station from FXCM is one of the most powerful and full-featured proprietary trading platforms for forex. Perhaps its main selling point is the availability of over 600 custom indicators, including fractal-based support and resistance lines, breakout indicators, and automatic Fibonacci/Gan level indicators. The powerful analysis tools allow for the backtesting of strategies, using historical market data, and strategy optimisation using a dedicated tool. There are also browser-based and mobile versions of the platform, but if you want to make full use of all the features, then you need the desktop version.
This powerful ECN forex platform allows traders to access deep liquidity from some of the world’s biggest banks, including Morgan Stanley and Deutsche Bank, with No Dealing Desk execution. The interface allows charts to be detached, and snapshots can be taken, which allows for a great deal of flexibility and also easy sharing. Traders can access multiple accounts from within the platform, which is available in desktop, web, and mobile versions. As well as being easy to use, the platform also incorporates some advanced features such as algorithmic trading and a full range of technical analysis tools.
This proprietary offering from Forex.com incorporates a number of advanced charting and analysis tools, including Autochartist pattern-recognition, trading signals from eSignal, and a custom-built strategy centre. For those that do not need all the features of the pro version, or are new to forex trading, there is a stripped-down version called FOREXTrader Lite that offers a much simpler interface with fewer features and functions.
TRADE
This platform from Forex.com differs from FOREXTrader PRO in many ways, offering fixed spreads, instant execution at the screen price, guaranteed stops, hedging, and over 300 currency pairs. There is no desktop version, as it is only available within your browser or as a mobile app. For technical analysis, TRADE offers Market DNA pattern-matching functionality, charting, and a strategy builder similar to that seen in FXPro’s cTrader.
As you might expect from a company that provides white-label solutions to some of the biggest names in trading, Saxo Bank’s own trading platform is one of the best in its class. Key features include extensive market analysis, direct communication with Saxo dealers, streaming news, and one-click execution. The layout can be fully customised (on desktop and web versions) and there is also a mobile version for use with smartphones.
With its departure from the European Union, the United Kingdom is experiencing the bitterness of the poison itself after Brexit. Because, for example, the export of meat to EU countries now has to face (and overcome) a difficult and lengthy bureaucratic process. To meet requirements which, in most cases, were created or suggested by the British themselves on imports from third countries outside the European Union.
Representative of the local meat industry, the Association of British Meat Processors (Bpma) is calling for help. It states that 20% of the sector’s exports are definitely lost and that to respond to transport, sanitary and customs requirements, around 30% to 40% of closed cargo shipments now made are costing 50% more than before Brexit. Or, as bpma points out, “to continue exporting to the European Union we will face an additional cost estimated between 90 and 120 million pounds”.
Seeking to demonstrate the difficulties that the meat industry now faces to reach the EU, the entity has drawn up a document in which it illustrates with an example – export, to Paris, of a batch of pork chops – the pre and post-Brexit bureaucracy.
By December 31, 2020, with an international consignment note (CMR), the transporter simply loaded the truck and the process was terminated. Time: 10 minutes and a single document.
Since January 1, 2021: until the truck leaves the factory, 20 different documents are required, which consumes between 4 and 12 hours. But this does not conclude the process, because, until it arrives in Paris, the cargo goes through nine other bureaucratic processes (passage through border posts, Customs and sanitary supervision, etc.).
To minimize these (for the British, unprecedented) challenges, the BPMA calls for (1) internal improvement in inspection and certification systems; (2) electronic documentation (even the color of the ink of a stamp on an invoice has hampered shipments); and, (3) search for sanitary equivalence with the EU.
In the words of the entity, “we can learn from other countries whose systems are much more flexible… to obtain services efficiently and economically”.
Forex trading historical positions ratios can be a useful tool when using sentiment analysis techniques to inform forex trades. They show the percentage ratio of long (buy) positions to short (sell) positions over time, and these can be interesting to compare side-by-side, or overlaid on the same graph, with the price movements over that same time period. These ratios are broker-specific, in that they only show the position ratios for traders that use a specific brokerage. This means that they do not necessarily reflect the sentiment of the market as a whole, but they are nonetheless useful for analyzing the aggregate reactions of online traders to the information that is presented to them.
Where to Find This Data
This data is not available from all brokers, and the way in which it is presented varies from brokerage to brokerage. However, if you learn how to interpret this type of data using a set of graphs from one brokerage, you may find that the same principles apply when it is presented in different ways, and it is important for forex trading. One firm that does provide this data is Canadian brokerage Oanda, which provides it in the form of two sentiment analysis tools, which we shall explain here. Other similar tools include DukasCopy’s SWFX Sentiment Index and FXCM’s Speculative Sentiment Index (SSI).
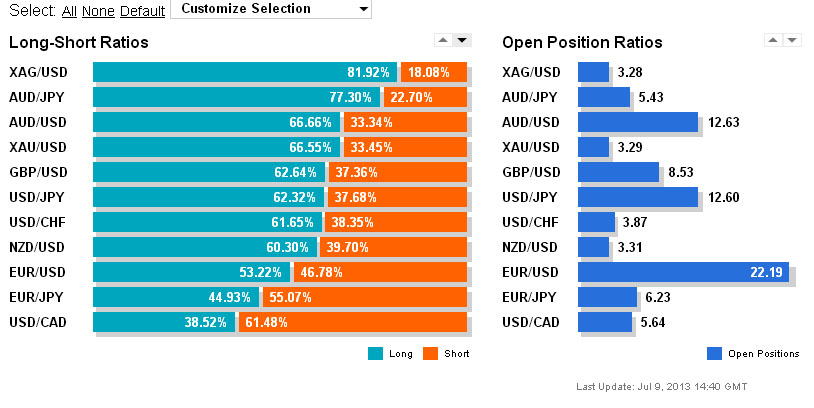
Figure 1: Current Long-Short Ratios and Open Position Ratios (source: OANDA)
The first graph shows a breakdown of current forex open position ratios for major currency pairs among Oanda customers, and is updated every 20 minutes. The bars are split into two colours, with the blue portion to the left displaying the percentage of long positions taken on that currency pair, and the orange portion showing the percentage of short positions for the same pair. This is accompanied by a second graph (right) that gives a breakdown of the percentage of total open positions on the broker’s order book that correspond to each of the major currency pairs. It should be noted that minor currency pairs are not included in the calculations, hence the percentages of these major currency pair open positions always adding up to 100%.
Figure 2: Historical Long/Short Ratios vs Price Data (Source OANDA)
The second graph show the long to short ratios for a given currency pair over time, in this case EUR/USD, among Oanda customers. When the ratio is more than 50%, it means that there are more long positions than short positions being taken, and when it is below 50% it means that there are more short positions than long positions being taken. If, for instance, we had a ratio of 70% for EUR/USD, this means that 70% of EUR/USD positions at that point were long, and 30% were short. This is overlaid with a graph of the actual price movements over the same period.
Forex Trading – How a Contrarian Investor Might View This Data
Sentiment analysis techniques, such as analyzing long/short ratios, are often used as part of a contrarian investment strategy. When following this type of strategy, a contrarian investor will interpret the data as a cue to do the opposite of what the majority are doing. When the ratio rises above 50%, it can be taken to mean that the crowd sentiment is bullish on that pair, which a contrarian will interpret as a sign to be bearish. By the same token, when the ratio is below 50%, this means that the crowd is bearish on that pair, which might lead a contrarian to the conclusion that they should be bullish on that pair.
Given that these are broker-specific indicators, ratios that are close to the 50% mark could be said to be pretty inconclusive in terms of general market sentiment, as there is an implied margin for error when taking such a small sample of the total market. However, ratios that are much bigger or smaller – such as over 60% or less than 40% – could be said to be a fairly useful indicator of how the market is feeling about a currency pair. Also, extremes of sentiment make it more likely that the crowd is wrong, especially if the ratio goes against the grain of the dominant trend in the market as a whole. So, if the EUR/USD is 75% long (ie extremely bullish), and the price trend is downwards, it means that the crowds are buying into EUR/USD losses in an aggressive way, which could be taken as a contrarian signal that the pair could go even lower.
Conclusion
Historical positions charts are just one tool that can be used as part of a wider analysis of market sentiment and forex trading. While they are flawed in one sense, in that they do not represent the entire market, they can nonetheless be useful indicators of what the majority of independent investors are doing, which if you take the view of a contrarian investor, can be a useful guide as to what not to do. By looking at these charts side-by-side or overlaid with a price chart (as in the Figure 2 above), you can see how frequently this tends to be the case. If the crowd were right, then a sustained period with a high long/short ratio should see an accompanying escalation in the price of the currency pair, but as we can see, the crowd are more often than not wrong – which is the concept that underpins the contrarian approach to investing.
For years, bitcoin was touted to be the preferred currency of criminals. A world that was devoid of proper authority, filled with weak points where hackers could waltz in and take whatever they wanted. Said to be worthless, unsafe, and unregulated. Fast forward a bit, to around 2017 when public adoption was on the rise, and bitcoin became a “fad”, just another bubble, unlikely to pan out or provide any real investment potential.
Frankly, none of this wears true of bitcoin then, and it’s certainly not true of bitcoin now. However, these classic arguments, put forward by bitcoins most vocal detractors do describe a financial system. Unfortunately, it’s the one backing our governments, paying our bills, and being used by us every single day. Even a novice bitcoin user could tell you that exchanges like Bitvavo are exceptionally secure. They’re quick and easy to use. They’ll never cause a global financial crisis, and in fact can function as an attractive hedge should fiat fail completely. They’re available for business 24/7, and possibly greatest of all- anyone can use it.
It’s always good to remember that when making payments with Bitcoin, we need reliable payment and invoice tracking services. Many companies offer this service with excellent quality, such as https://www.zintego.com.
Central Banks vs. Bitcoin
Speaking frankly, bitcoin is probably more safe than traditional financial options because it is free of one commonality. An eventuality that will degrade the goodness of near any medium it’s applied: the power of greed. While bitcoin is absolutely used as a medium in which to increase gains and bolster portfolios, but because of its decentralized nature, the whims of powerful individuals are largely left outside of the regulatory and functional aspects of the digital asset.
The usefulness, and the inherent safety, of this decentralized structure can be easily distinguished when you look at centralized banking structures and digital currencies side by side. Despite a well-known, and largely explicit, history of less-than-toward banking practices; despite a fiat based on nearly as much physical worth as bitcoin itself- many still trust these legacy institutions. Why? Well, for one- digital currencies can be confusing.
Transactions
Despite the multitude of intricacies that go into making one transaction at your local bank, it’s something that the major majority of the well banked world is supremely familiar with. Even if it’s simply on a superficial level. Depending on what country you’re hoping to originate your bank-to-bank transfer in, and consequently where you want your transaction to terminate, bank transfers are relatively simple.
You choose an account to either send money to, or take money from, give this number to the other participating party. Personally, identifying information and amounts exchanged, the transaction goes through your bank’s digital network. After putting a hold on the funds that will be withdrawn, your bank turns toward its IT system. If your bank exists within the same network as the bank you’re transacting with, the procedure is relatively quick, mostly safe, and fairly inexpensive. Should you require your bank to go outside of their network, transactions can become prolonged, expensive, and more dangerous. Exposing users to fraud, scams, and exposure of their personally identifying information.
Bitcoin is a truly global banking system, where sending money to the most unusual places is still secure, relatively inexpensive, and nearly instant. Otherwise, transaction processes between banks and bitcoin work somewhat similarly. Instead of your name, address, bank account number, and sorting code however- all you send is a public key, comprised of a series of numbers and letters, that is associated with your wallet address. This particular key can never be used to withdraw funds from your wallet, only to identify where it is. In order to actually send or receive funds, bitcoin users must privately “sign” a bitcoin transaction with their private key. A piece of information that you share with no one.
Safety
These public and private keys are one of the things that helps keep bitcoin safe. When transacting digital currencies, it’s just not necessary to share personally identifying details like your address or social security number. So, the likelihood of this information becoming public is exceptionally slim. Unlike the centralized banking system, as many have been the victims of identity fraud thanks to the outmoded practices used by many banks.
Bitcoin is also safe from inflationary practice, as the coin relies on an economic principle called “artificial scarcity” to derive its value. This means that a finite amount of bitcoin is in existence, and only that amount will ever exist. No more can ever be created. So, the crypto relies on the models of supply and demand to hold its value. Fiat, on the other hand, can essentially be printed at any time a government deems it necessary, which can cause some serious problems for consumers. As seen in the hyper inflated financial landscape of Argentina, or the 2008 housing market bubble and crash.
Bitcoin is also safe because it’s transparent. Centralized banks buy debt, create debt, and essentially make money off of using your own- in ways that you’re unlikely to ever see, as it is rare for a bank to open up their books to the public. Bitcoin uses a distributed ledger technology called blockchain. The blockchain is a public record of every transaction that has ever been made on the bitcoin network. While these transactions can be viewed, they cannot be reproduced or altered once they are added to the blockchain. Creating a self-sustaining environment of transparency. Miners (those computers that verify and add the transactions) are rewarded in freshly minted bitcoin and transaction fees, but no further money can be made, so there is no financial incentive to engage in risky monetary practice- nor is it even possible.
This is an article provided by our partners’ network. It does not reflect the views or opinions of our editorial team and management.
Double tops and double bottoms are classic reversal patterns, especially prevalent in charts with shorter time frames. However, distinguishing between a genuine reversal pattern and mere market volatility can be challenging. This challenge becomes more pronounced in charts with very short time frames, like an hour or less, where market fluctuations can obscure the actual price action movement at such a detailed level.
While double tops and bottoms are powerful reversal patterns sought by traders, their interpretation can be a double-edged sword. The price often gives the appearance of forming a double top or bottom, only for the supposed resistance or support line to be swiftly breached. Fortunately, there are several strategies traders can employ to differentiate between a true reversal and a false double top or bottom.
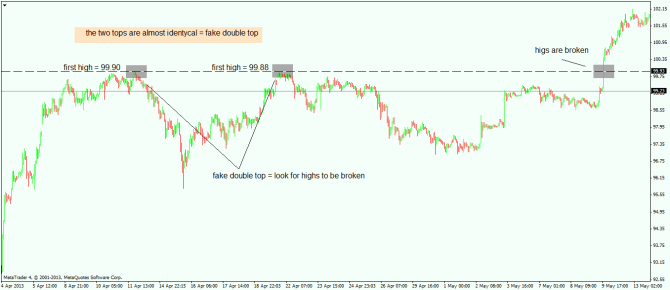
Firstly, it’s crucial to note that a double top or bottom refers to the region where the price reverses, and this range can vary from tens to hundreds of pips depending on the time frame. When observing a potential double top or bottom and the prices for the two potential tops or bottoms are very close, the likelihood is that the pattern is false, and the price will break through those levels.
For instance, consider the USD/JPY breaking the 100 level last year. In the subsequent chart, you can observe the price approaching the 100 level, reaching 99.90 before sharply reversing. Subsequently, the price ascends nearly to the same point, at 99.88, before once again reversing sharply. When the two tops are so closely aligned, nearly identical, it signals a false double top, indicating that the highs will likely be surpassed, as demonstrated in this case.
Delaying action until the neckline is breached
In the context of a double top pattern, certain traders opt to sell when the price experiences a second dip, occurring shortly after the rebound and the formation of the second peak. While this approach carries higher risk, the potential reward is also greater.
A less risky strategy involves placing the sell order after the price has dropped below the neckline support, turning this support into resistance. When combined with the upper line, two resistances are then positioned above the current price level. Breaking through both is necessary for the upward trend to resume.
While not a foolproof method, this approach does offer some confirmation that the trend is indeed undergoing a directional change.
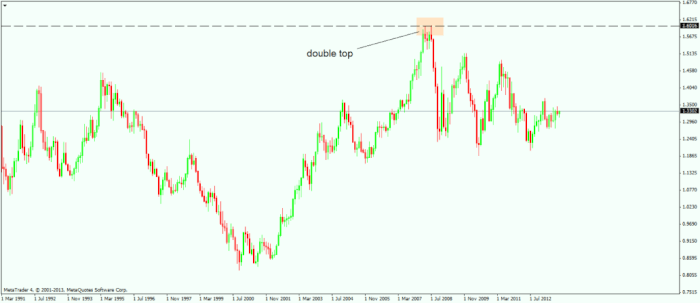
Another critical factor to consider is the time interval between the two potential tops or bottoms. The longer the duration between them, the higher the probability of it being a deceptive move. Conversely, a shorter timeframe between them, up to a certain point, increases the likelihood of a genuine reversal. An illustrative example can be found in the EUR/USD monthly chart from 2008 when the price exceeded the 1.60 level. The brief period between the two tops signifies an authentic reversal in progress, and, as observed, that is precisely what unfolded.
Distinguishing between a double top and its counterpart, the double bottom, is primarily based on the number of resistance retests. The critical factor lies in recognizing the subtle differences between these two closely related chart patterns.
Cookie Duration Description:The number of resistance retests is a defining feature. A double top involves two peaks at a similar price level, forming a distinctive ‘M’ shape. Conversely, a double bottom displays a ‘W’ shape, indicating two troughs at roughly the same level.
Target Measurement:The target measurement is calculated from the lowest trough to the level of the intervening peak. This measurement provides an estimate of the potential downward move after the confirmation of a double top pattern.
Market Rejection and Support:Following the formation of the second peak, the market is typically rejected from this level, retracing back to the same support level. This reinforces the significance of the resistance-turned-support dynamic.
Third Criteria:Moving forward, the third criterion involves observing the price action as it approaches the established support level. A clear confirmation of the double top pattern occurs when the price breaks below this level, indicating a potential trend reversal.
Trading Strategy:To effectively trade with the double top chart pattern strategy, focus on making informed decisions using naked charts. Rather than waiting for the market to swing into support with a larger stop loss, consider placing your stop loss at a shorter distance. This adjustment minimizes potential losses in case the market swiftly reverses towards the upside.
Understanding the nuances of the double top pattern and implementing a strategic approach to trading it can significantly enhance your ability to identify profitable opportunities in the market. By incorporating these insights into your trading strategy, you can navigate the complexities of price action and make more informed decisions.
Therefore, although it holds true that double tops and bottoms can serve as potent reversal patterns, the key lies in discerning with a reasonable degree of accuracy which ones are genuine and which are deceptive. Given their frequent occurrence, it’s easy to be misled, but mastering the ability to correctly identify them can unveil substantial profit opportunities.
Navigating the world of foreign exchange, or forex, might seem a bit overwhelming, especially for those hands-on investors out there. But hey, don’t worry! There’s a bunch of books about currency trading, from the basics of the forex market to some fancy strategies involving fundamental and technical analysis. Let me share the list of best forex trading books that have been through the highs and lows of the forex market and are still going strong
Courtney Smith kicks off ‘How to Make a Living Trading Foreign Exchange’ by giving readers a solid introduction to the workings of the forex market. However, the majority of this 2010 masterpiece is dedicated to the pursuit of making money, unveiling six strategies for cultivating a steady income through trading. Smith doesn’t skimp on essential risk management techniques and delves into the psychology of trading. What sets this work apart is Smith’s elucidation of his distinctive ‘rejection rule,’ a strategy crafted to amplify profits derived from fundamental channel breakout systems
For those just dipping their toes into currency trading, ‘Currency Trading for Dummies’ stands out as a top pick. Packed with clear and easy-to-follow instructions on navigating currency trading and understanding the forex market, this book is not just for beginners—it’s a handy refresher for seasoned pros too. Often cited by the financial media, this gem, originally published in 2011, got a modern update by none other than Brian Dolan, the former chief currency strategist at Forex.com, and Kathleen Brooks, the director of research at Forex.com.
Kathy Lien, the powerhouse currency analyst, managing director at BK Asset Management, and a familiar face on Bloomberg, CNBC, and Reuters, has truly mastered the art of demystifying forex. In the third edition of her book, Lien takes a dual-pronged approach, blending theory and hands-on learning with a well-balanced perspective on fundamental and technical forex trading strategies, all geared toward consistent profits. Guiding readers step-by-step, she unravels the complexities of Forex fundamentals, exploring both long- and short-term factors influencing currency pairs. Plus, she sheds light on the technical analysis strategies used by professional forex traders in their day-to-day operations.
True to its title, this book is all about laying the groundwork for beginners. The author, a self-taught forex trader with a passion sparked at a private gathering for stock traders, breaks down the essentials in a way that’s crystal clear. Brown’s writing, while never condescending, assumes nothing about the reader’s existing knowledge. Covering the ABCs of forex and forex markets, strategies for making entries and exits, trading psychology, the nitty-gritty of forex pairs, where to trade foreign currencies, tips on choosing a broker, and even sharing his own trading strategy, Brown offers a roadmap that novices can follow or tweak to create a personalized trading journey.
Steve Nison’s ‘Japanese Candlestick Charting Techniques’ is celebrated for introducing the versatile tool of candlestick charting to the Western world, now widely embraced by forex traders. This comprehensive book offers a deep and extensive education on candlestick charting, a technique applicable not only to forex but also to futures, speculation, hedging, equities, and anywhere technical analysis is in play. Nison’s work serves as an invaluable resource for traders looking to elevate their strategies. For those hungry for more insights, Nison’s sequels, including ‘The Candlestick Course,’ ‘Beyond Candlesticks: New Japanese Charting Techniques Revealed,’ and ‘Strategies for Profiting with Japanese Candlestick Charts,’ provide further exploration into this powerful charting method
Drawing on his firsthand knowledge of the challenges traders confront, Dr. Brett Steenbarger offers insights into overcoming these hurdles using performance and psychological strategies. In ‘Enhancing Trader Performance,’ Steenbarger guides readers on the journey of turning talent into trading skill. He unveils a structured process for developing expertise and illustrates how this approach can pave the way for achieving success in the market
Wayne McDonell, the go-to guy as Chief Currency Coach at FX Bootcamp, has put together a user-friendly handbook for navigating today’s Forex market. McDonell shows you the ropes on making savvy trades and walks you through the art of blending common technical indicators to craft a winning market strategy. His book lays out a practical trading plan and, in the process, dives into the real hurdles a Forex trader encounters—stuff like battling greed, dealing with fear, handling losses, and the occasional sense of isolation
In this bestselling second edition, Tharp provides traders with a distinct advantage in today’s market landscape. Covering all facets of the market environment, he introduces his new 17-step trading model. The book incorporates updated examples and charts, delves into reward-to-risk multiples, and enriches the reader’s understanding through insightful interviews with top traders
Nison, the pioneer who brought the candlestick technique to the West in two prior bestselling forex trading books, takes it a step further in ‘The Candlestick Course.’ Breaking down patterns of varying complexity, he engages readers with quizzes, Q&As, and extensive examples to test and reinforce their knowledge. Written in accessible and easy-to-understand language, this book provides expert guidance on the practical applications of candlestick charting, ensuring traders of every level gain a comprehensive understanding of this powerful analysis technique.
This comprehensive, fully illustrated how-to book unveils six original and definitive technical trading systems. Built on the premise that no single technical trading system consistently generates profits in both robust directional markets and non-directional congestion markets, the book provides insights and strategies for navigating diverse market conditions.
Catering to both novices and seasoned traders, Murphy demystifies the concepts of technical analysis and their practical applications. He skillfully interprets the role of technical forecasters, elucidating how they leverage their techniques in the financial markets. Serving as an excellent primer for both technical and fundamental analysis, this book also serves as a gateway, directing readers towards other valuable sources of knowledge in the field.
In his exploration of intermarket analysis, Murphy dissects the intricate relationships between global equities, bonds, currencies, and commodities. Written in straightforward language, he builds a compelling case for intermarket analysis, cutting through the noise of conflicting economic news and daily viewpoints. The result is a clear and current picture of the interwoven dynamics shaping the financial landscape.
In this second edition, Lien offers a diverse array of technical and fundamental strategies for achieving profitability in currency trading. Drawing on time-tested approaches, she equips traders with the tools to compete at the highest levels. The book covers not only technical strategies but also delves into fundamentally-oriented approaches, exploring intermarket relationships, interest rate differentials, option volatility, news events, and the impact of central bank interventions.
“Douglas emphasizes that successful trading is predominantly a psychological game, attributing 80% of success to mindset and only 20% to methodology. He identifies emotion as the adversary of triumphant trading. In his forex trading book, Douglas articulates that even with a modest grasp of fundamental and technical information, those who maintain psychological control will thrive in the dynamic trading environment
Continuing from where ‘The Disciplined Trader’ left off, Mark Douglas dives deeper into the psychology of trading in his sequel, ‘Trading in The Zone.’ Focused on bridging the gap between perceiving market movements and executing trades, this book goes beyond the technicalities. Its purpose is to provide readers with profound insights into themselves and a deep understanding of the trading landscape, aiming for sustained success by unlocking the nuances of the trader’s mindset.
In the follow-up to his highly acclaimed trader interview collection, ‘Market Wizards,’ Jack Schwager delivers valuable insights into investing gleaned from some of Wall Street’s most esteemed professionals. Sharing firsthand accounts of remarkable successes and self-inflicted setbacks from prominent traders and investors, Schwager illustrates that even small investors can sidestep pitfalls and optimize their financial endeavors. Through inside stories and practical advice, he empowers readers to navigate the intricate world of finance with confidence and wisdom.
Lien and Schlossberg join forces to unveil a strategy on how to outsmart Wall Street in its own arena. In ‘Millionaire Traders,’ they introduce twelve everyday individuals who have metamorphosed into highly successful traders. The book delves into their insights and practical advice, centering on equities, futures, and foreign exchange, scrutinizing the diverse paths they’ve navigated to achieve substantial profits. Packed with a wealth of strategies, this book provides a versatile toolkit for making money in today’s dynamic financial markets.
Forex trading books provide invaluable insights and strategies, serving as essential guides for traders navigating the dynamic world of foreign exchange markets.
In conclusion, the world of Forex trading is rich with resources, and Forex trading books stand as indispensable companions on the journey to mastering the complexities of currency markets. Whether you are a novice looking for foundational knowledge or an experienced trader seeking advanced strategies, Forex trading books offer a wealth of wisdom, insights, and practical techniques to enhance your trading performance and navigate the ever-changing landscape of the financial markets.
Today we will talk about one of the most important themes for the trader which are deposit and withdrawal funds. For the beginning, we will tell how it happens with the WFT Group broker.
Every broker has his own rules and principles how to deposit money by traders on the platform. Surely, the WFT group has its own system. But, it’s quite different from the input system of other brokers. The difference is for the better, that’s why we decided to consider it in more detail.
The Way to Involve in The Trading
Usually, brokers are offering several ways how to deposit money on their platform (with fiat currencies, electronic money as YAD, web money, Qiwi etc.), which are differ directly in the input technology and the percentage for the transaction. Moreover, there are usually more ways to deposit money than ways to withdraw.
With WFT Group brokers situations is different. He has approximately the same number of ways to deposit and withdraw earned money. Of course, there is a standard withdrawal of funds to bank cards of various international payment systems, as well as a bank transfer.
Also there are ways to withdraw funds to electronic wallets. Many brokers have a way to deposit funds using electronic wallets, but no withdrawal to them. This is due to legal problems – it is necessary to conclude agreements with the owners of these electronic payment systems, to undergo a check with them. All this is time, money and hassle. WFT Group went to all this for the convenience of its clients. And now its traders can withdraw Funds to electronic wallets. You can withdraw part of the funds to a bank card, and part to electronic wallets. Such diversification allows you to avoid additional conversion (for example, if you need to transfer money from a bank card to an electronic wallet for a purchase), which means additional expenses.
WFT Group – Transactions via e-wallets
At the moment, the broker of WFT Group can withdraw funds to the following electronic wallets – Webmoney, Qiwi & Neteller.
Web Money is one of the oldest payment systems in Russia and CIS countries.
Due to its reliability, which is proved over the years, it has many users. The big advantage of Web Money is that it has a large number of electronic currencies (fiat currency equivalents). It also has electronic wallets for several cryptocurrencies.
Qiwi is one of the most popular electronic money in the world. It has a large number of ways to enter funds into this system, including using a variety of special Qiwi terminals.
Neteller is also one of the oldest payment systems that can be used to make international payment transfers around the world. It supports 26 currencies including USD, Euro, Yen, British Pounds, Swiss Franc, etc.
As you can see, WFT Group offers three of the most popular e-wallets. Another small convenience – by default, the system offers a withdrawal of funds in the same way as input. After all, users usually deposited and withdraw funds to the wallet that they often use. But, again, you can deposit and withdraw funds in different ways, including partly in one option, partly in another.
WFT group – withdrawal of funds
One of the most painful moments in the relationship between a trader and his broker is the withdrawal conditions. For some reasons, many brokerage companies operate according to the principle: “Entry – one ruble, exit – two rubles.” That is, it is easy and simple to deposit money on their platform, but it is much more difficult to withdraw money. In this regard, the WFT Group is a welcome exception. Let’s list the rules for withdrawing our earned funds from this broker:
WFT Group does not charge a commission for a single withdrawal within a month. The commission is charged only by the payment system through which the transfer is made – Visa, MasterCard, Qiwi, Webmoney, etc. From second and subsequent transfers during the month, the WFT Group withholds $ 12, regardless of the transfer amount.
The minimum amount of transaction – 25 dollars or euro, (other brokers usually have a minimum hold of $ 100). This is very convenient for innovator traders who usually cannot immediately boast of big earnings.
The withdrawal period does not exceed 24 hours (for other companies, the standard period is 3 banking days). Want to mention that 24 hours is the time it takes for WFT Group to transfer money for transfer to the payment system, which may have its own terms for transferring funds.
Due to the approval of fiscal state policy, WFT Group may require the submission of documents to verify identity. But, let us clarify again, this is due to state policy, and such restrictions have all brokers.
Money for Withdrawal
A unique feature of the WFT Group in its withdrawal policy is that you can withdraw ALL money that is currently in the trader’s deposit, including those, which are received as bonuses. Of course, except of those, which are involved in open positions. So, bonuses can be withdrawn from the deposit according to the general rules! Other brokers significantly limit the withdrawal of bonuses or even prohibit the withdrawal of such funds.
Based on the foregoing, we can recommend both to beginners and experienced traders WFT Group as a broker.
WFT Group Reviews
A broker is required for trading. Therefore, people who want to make money on this, read reviews of brokers on the Internet in order to find the most professional for themselves, who will help them become successful.
We want to warn you. Very often the reviews are not real! For example, you can find notes that the WFT Group is a deception, that they are scammers. Although, objective information from this company suggests otherwise.
These messages can have two purposes:
1. They blackmail the broker in order to get money from him for deleting such notes.
2. To defame a broker so that novice traders can go to another broker.
It is no coincidence that such texts appear exclusively on sites that have been repeatedly caught in blackmail and posting paid reviews.
Before you believe the message from an unknown person that WFT Group are scammers, please, make an objective analysis, according to absolutely reliable and easily verifiable information.
WFT Group is an international broker with many years of experience and the winner of many prestigious competitions.
It cooperates with over ten thousand traders all over the world.
Offers convenient and fast money deposit and withdrawal.
Insures traders from unsuccessful deals.
Offers traders the most advanced trading software available today – the platform MetaTrader5.
We encourage traders to work with the WFT Group to make objective assessments of this broker. Let’s make the Internet more truthful together and help novice traders to make the right choice.
Want to lose money? The internet is full of trading ideas that will help you do just that. What you need is not to...
We use cookies on our website to give you the most relevant experience by remembering your preferences and repeat visits. By clicking “Accept”, you consent to the use of ALL the cookies.
This website uses cookies to improve your experience while you navigate through the website. Out of these, the cookies that are categorized as necessary are stored on your browser as they are essential for the working of basic functionalities of the website. We also use third-party cookies that help us analyze and understand how you use this website. These cookies will be stored in your browser only with your consent. You also have the option to opt-out of these cookies. But opting out of some of these cookies may affect your browsing experience.
Necessary cookies are absolutely essential for the website to function properly. These cookies ensure basic functionalities and security features of the website, anonymously.
Cookie
Duration
Description
cookielawinfo-checbox-analytics
11 months
This cookie is set by GDPR Cookie Consent plugin. The cookie is used to store the user consent for the cookies in the category "Analytics".
cookielawinfo-checbox-functional
11 months
The cookie is set by GDPR cookie consent to record the user consent for the cookies in the category "Functional".
cookielawinfo-checbox-others
11 months
This cookie is set by GDPR Cookie Consent plugin. The cookie is used to store the user consent for the cookies in the category "Other.
cookielawinfo-checkbox-necessary
11 months
This cookie is set by GDPR Cookie Consent plugin. The cookies is used to store the user consent for the cookies in the category "Necessary".
cookielawinfo-checkbox-performance
11 months
This cookie is set by GDPR Cookie Consent plugin. The cookie is used to store the user consent for the cookies in the category "Performance".
viewed_cookie_policy
11 months
The cookie is set by the GDPR Cookie Consent plugin and is used to store whether or not user has consented to the use of cookies. It does not store any personal data.